
First establish what each number measures
A solar app usually starts with the system it knows about. Your electricity bill starts with energy recorded at the billing meter and the charges in your retail plan. Those are different boundaries. Electricity used inside the house need not cross the billing meter at all. Consequently, a large generation total alongside a smaller export total can be entirely reasonable. The first useful question is which measurement each screen actually represents.
Write down the label beside the number, the unit, the period and the device supplying it. A screen marked lifetime energy cannot be compared with one billing quarter. A live power display cannot be compared directly with a daily energy total. If an app shows only an inverter icon and a generation graph, do not assume a house-consumption figure is hiding elsewhere. Ask what additional monitoring equipment, if any, was installed.
For a Pakenham household, the address itself does not settle any of these questions. Two houses in Lakeside can have different inverters, monitoring arrangements, retail plans and working hours. Start with your own system and bill rather than a neighbour's screenshot. Keep the original files so that someone investigating later can see their labels, rather than a handwritten total with no context.
Reconcile dates before comparing performance
Download a bill and find its actual start and end dates. Then choose that same range in the app. Note whether the last day is included, whether the app has complete data and whether an estimated reading appears on the bill. A calendar-month app report and a bill covering parts of several months will disagree even when both systems work correctly. This simple mismatch can otherwise waste an entire service conversation.
Use energy quantities before money. Record imported and exported kilowatt-hours separately. Then record supply charges, import rates, export credits and any adjustments. A change in rates can increase the amount payable without increasing energy consumption. Conversely, a credit carried forward can make a poorly performing month look inexpensive. Comparing only the final payable amount hides both effects and is a weak way to judge the solar system.
Take care with hourly or shorter records around clock changes. If peaks consistently appear shifted, confirm timezone settings with the app provider and retailer instead of manually moving data until it looks right. Mark missing intervals as missing, not zero. A zero means a measured absence of energy; an empty interval means that the information is unavailable. Preserving that distinction gives the technician a much better starting point.
| Reading | What it describes | Compare it with |
|---|---|---|
| Generation kWh | Energy produced over an interval | The matching generation interval |
| Export kWh | Energy leaving the property | Retailer export quantities |
| Grid import kWh | Energy bought from the grid | Retailer import quantities |
| Live kW | Power at one moment | Another reading at the same time |
Follow the energy through the house
Sketch a simple flow on paper: panels produce energy, household appliances use some, a battery may charge, and the remainder can be exported. At other times the house buys energy from the grid. This is a description of the energy paths, not a claim that the app measures every path accurately. Label which arrows are measured and which are calculated. Ask the installer to explain any derived household-consumption total.
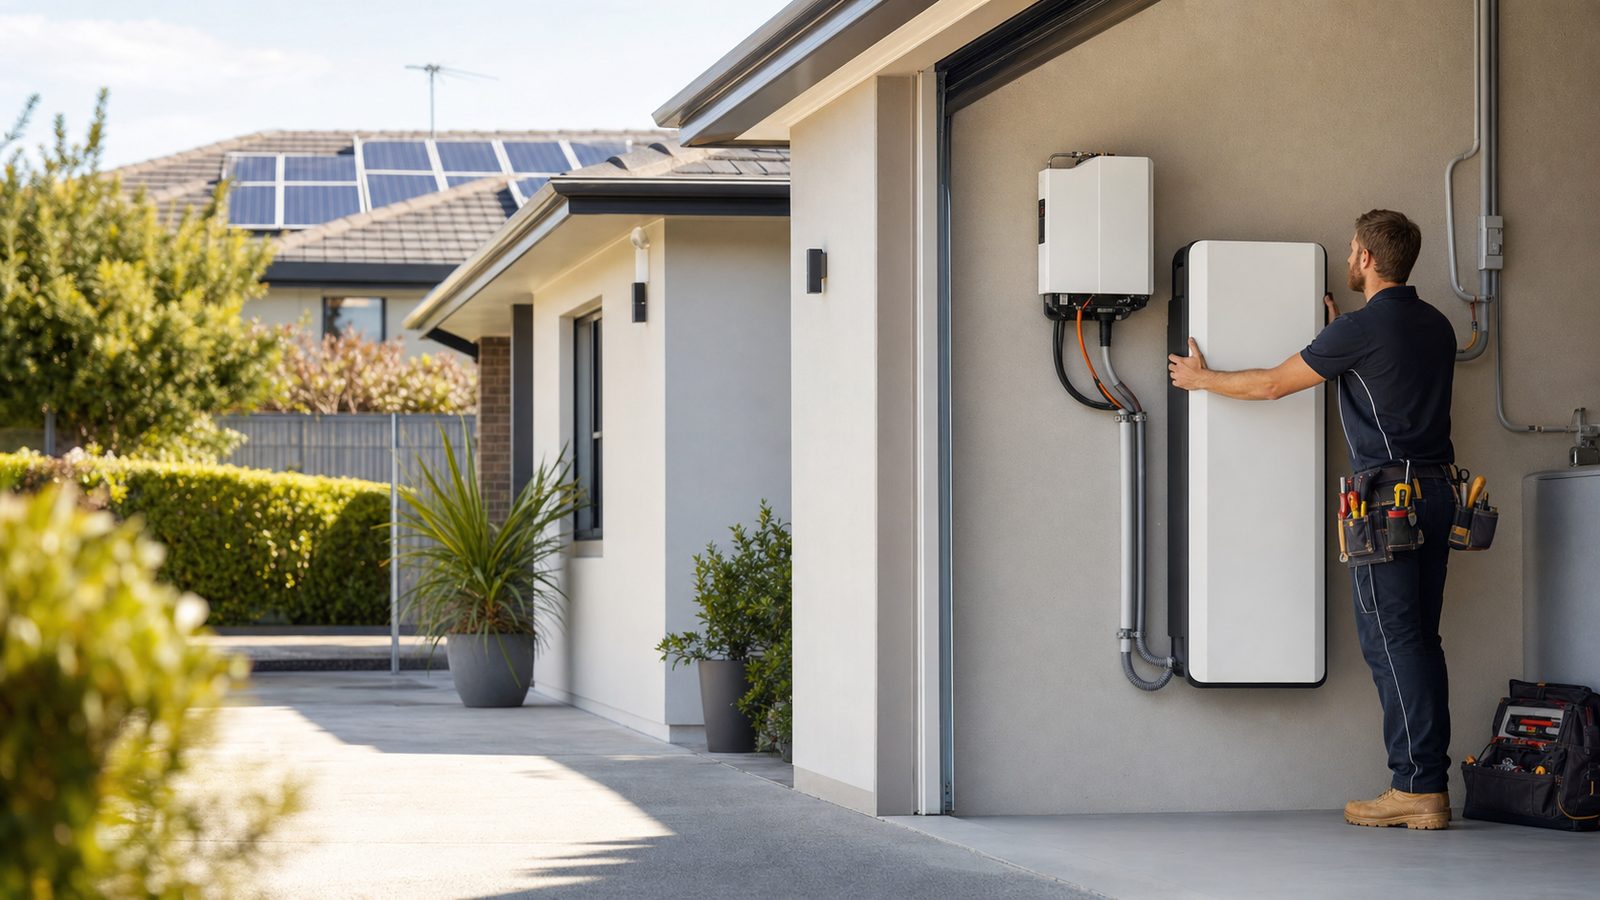
If a battery is present, record its operating mode and reserve setting without changing installer settings. Energy held for backup may remain unused for routine bill reduction. A charging schedule may deliberately buy grid energy. A virtual power plant arrangement can introduce another control schedule. None of those observations proves a fault. They explain why a battery icon alone is insufficient evidence that all night-time purchases should disappear.
Avoid combining totals from incompatible boundaries. Battery charging and discharging figures may be measured at different points and include different losses. A daily generation total plus a daily battery-discharge total is not necessarily a new supply of energy to add together, because stored solar can then be counted twice. Ask for the provider's definition of each export before building a savings spreadsheet from the numbers.
Separate an internet gap from a production gap
Check the timestamp before interpreting an empty graph. If the app last updated before a router replacement, the first investigation should include communications. Confirm that ordinary devices can use the household connection, note whether the equipment's network connection changed, and look for the manufacturer's owner-level reconnection instructions. Keep passwords out of screenshots sent for quoting or support. Do not reset equipment indiscriminately to see what happens.
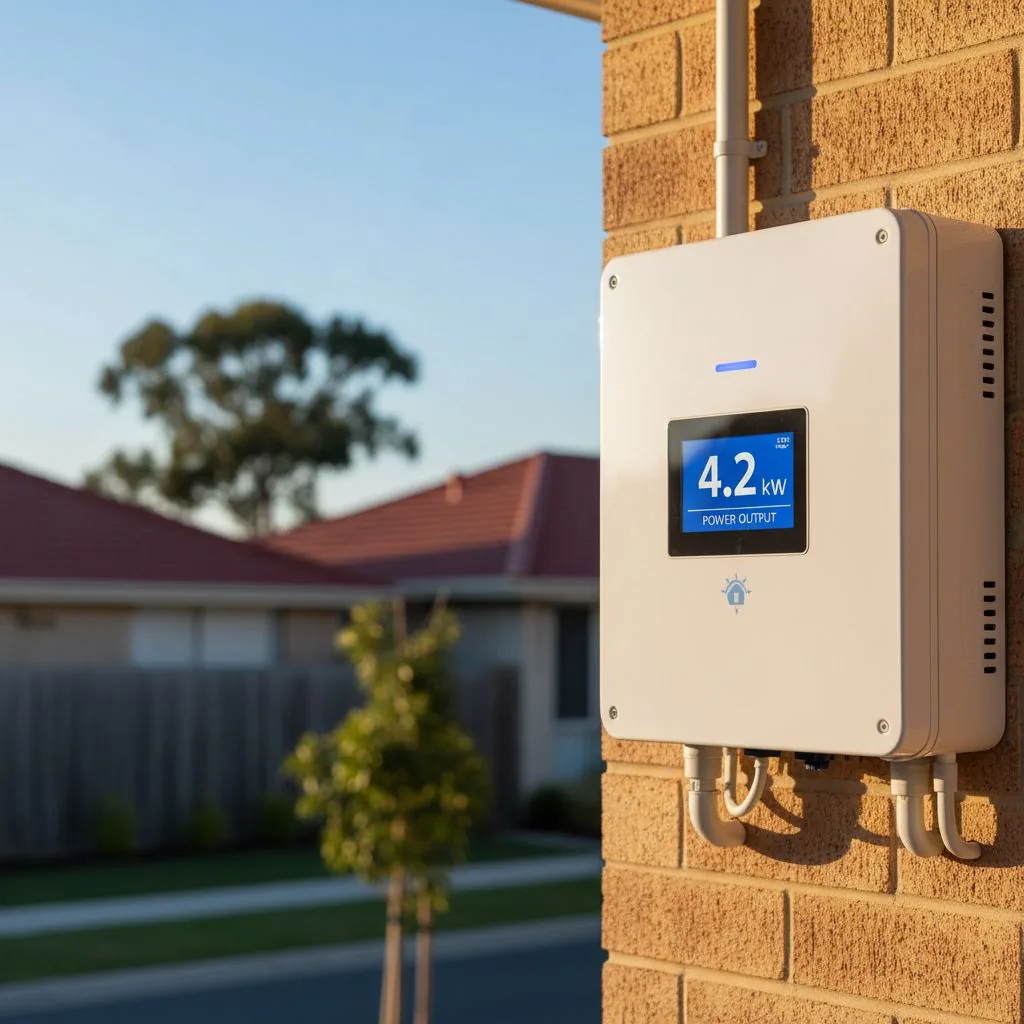
From a safe standing position, note an accessible display or status light if the manufacturer identifies it for homeowner use. Record the exact message rather than translating it into a diagnosis. A phrase such as communication lost, grid unavailable or standby gives support a more specific starting point than broken solar. If equipment is inaccessible, do not climb, remove covers or reach around wiring to obtain a photograph.
Ask whether missing cloud history can be recovered, whether the device kept a local record and whether alerts depend on an internet connection. Some gaps may remain gaps. That does not justify filling them with a convenient estimate and presenting it as measured output. Request an explanation that distinguishes confirmed generation, unavailable data and any separate equipment fault. Save the support reference so the next person does not restart the investigation.
Look for a repeatable pattern
Choose several comparable days rather than the best day last summer. Make a short diary of weather, occupancy and large appliances. A work-from-home day with heating and cooking differs from an empty-house day even if the generation curves look similar. If a new EV, heat pump or second refrigerator arrived, mark the date. Your before-and-after comparison should begin with that change rather than an assumption that the panels have deteriorated.
A narrow dip at the same time on otherwise clear days is worth documenting. A broad flat section, a sudden stop or a repeating warning can also be useful evidence. These patterns have multiple possible causes, including control settings, shading and faults. Give the installer the raw graph and dates; avoid diagnosing a specific failed component from the shape alone. The point is to make a professional investigation more targeted.
The remedy for a suspected monitoring error is verification of the measurement setup, not a new appliance schedule. If reported house consumption rises when solar production rises despite an apparently quiet house, save examples and ask about the sensor configuration. Never open a switchboard or move a clamp to test that idea. The owner-level task is gathering evidence and explaining what was actually running at the time.
A household example that leads to a better question
Hypothetical example: a family in Officer sees strong solar generation while its latest bill rises. They initially suspect an inverter problem. Their comparison instead reveals that the billing period is longer, a new car is charging after dinner, and the app shows generation only. They cannot calculate total household use from that app alone, so the next useful request is retailer interval data for the exact billed dates.
The family saves the charging schedule and compares evenings when the car was connected with evenings when it was not. They also separate the daily supply charge from energy charges. This does not establish what the final savings should be, but it tests a clear hypothesis: whether the extra imports occur when the new load operates. A general claim that solar is not working becomes a specific question that can be answered.
If the interval records still fail to explain the bill, the family sends the same evidence bundle to the appropriate contact. Billing quantities and retail rates go to the retailer. Monitoring configuration and generation interruptions go to the installer or equipment support. They keep both responses together so a billing query is not repeatedly redirected as a hardware query without anyone examining the underlying records.
Make the support request easy to investigate
Prepare one folder with the bill, the app export, system model details, dates of relevant household changes and a short description of the symptom. Redact account numbers where they are unnecessary. Use original screenshots with readable axes. A photograph of the entire phone from across a room can conceal the timestamp and unit that matter most. Name files with the date and the question they illustrate.
Write a concise request such as: these dates show missing app data, the inverter display remained active, and the router changed the previous evening. Ask which observation would distinguish lost communications from lost generation. For a bill problem, ask which meter quantities and rates produced the disputed line. A focused request is easier to resolve than demanding a replacement battery before the cause is understood.
Keep a record of changes made during support, including dates, the person responsible and whether the old settings were recorded. After a correction, compare a fresh period using the same method. Do not call the issue resolved simply because the app now displays a green icon. Confirm that the originally confusing quantities can be explained and that any agreed monitoring function supplies usable data.
Set a low-effort review routine
Once the system is understood, decide what deserves attention. Checking every passing cloud creates noise. A missing daily update, a repeated fault message or a sustained change relative to comparable conditions is more actionable. Ask the provider which alerts are available, who receives them and whether there is an ongoing service arrangement. An app notification is not evidence that someone else has taken responsibility for responding.
Keep a small reference record of a normal operating day, your system equipment and the relevant support contacts. Review the setup after a router change, retailer change, major appliance purchase or battery operating-mode change. Those events can alter either the data or the household demand. They are useful checkpoints even when nothing has physically failed on the roof.
The successful outcome is a bill and monitoring record you can explain. Sometimes that leads to a repair, sometimes a sensor correction, and sometimes a change in when appliances run. Collecting the evidence first prevents an unnecessary purchase and makes any genuinely needed work easier to specify. Use the brief below to choose the next checks that match your situation.